The Housing Stability Monitor is an ongoing research series that provides quarterly updates on eviction and foreclosure trends in Massachusetts. This is the sixth edition of the Housing Stability Monitor and explores data through December 2025.
Posted on May 14, 2026
By Matija Jankovic at MHP’s Center for Housing Data
Over the last four years, MHP’s Center for Housing Data has been researching and reporting on housing stability in Massachusetts. Amid fluctuating unemployment rates, wavering legal protections, changes to crucial support systems, and ever-growing rents and home sale prices, trends in eviction and foreclosure rates in the Commonwealth deserve regular attention.
We are committed to making this critical data available to the public and releasing regular editions of this research. Prior editions are available for download below, and this edition showcases the latest available housing stability data. We encourage you to explore the latest eviction and foreclosure trends to see how your community has been affected.
EVICTIONS
Eviction filing volume at the state level is a good starting point for examining broader housing stability trends in Massachusetts. Filing levels can shift in response to policy changes, fluctuations in the state’s economy, housing shortages, and seasonal events that create financial pressures for households.
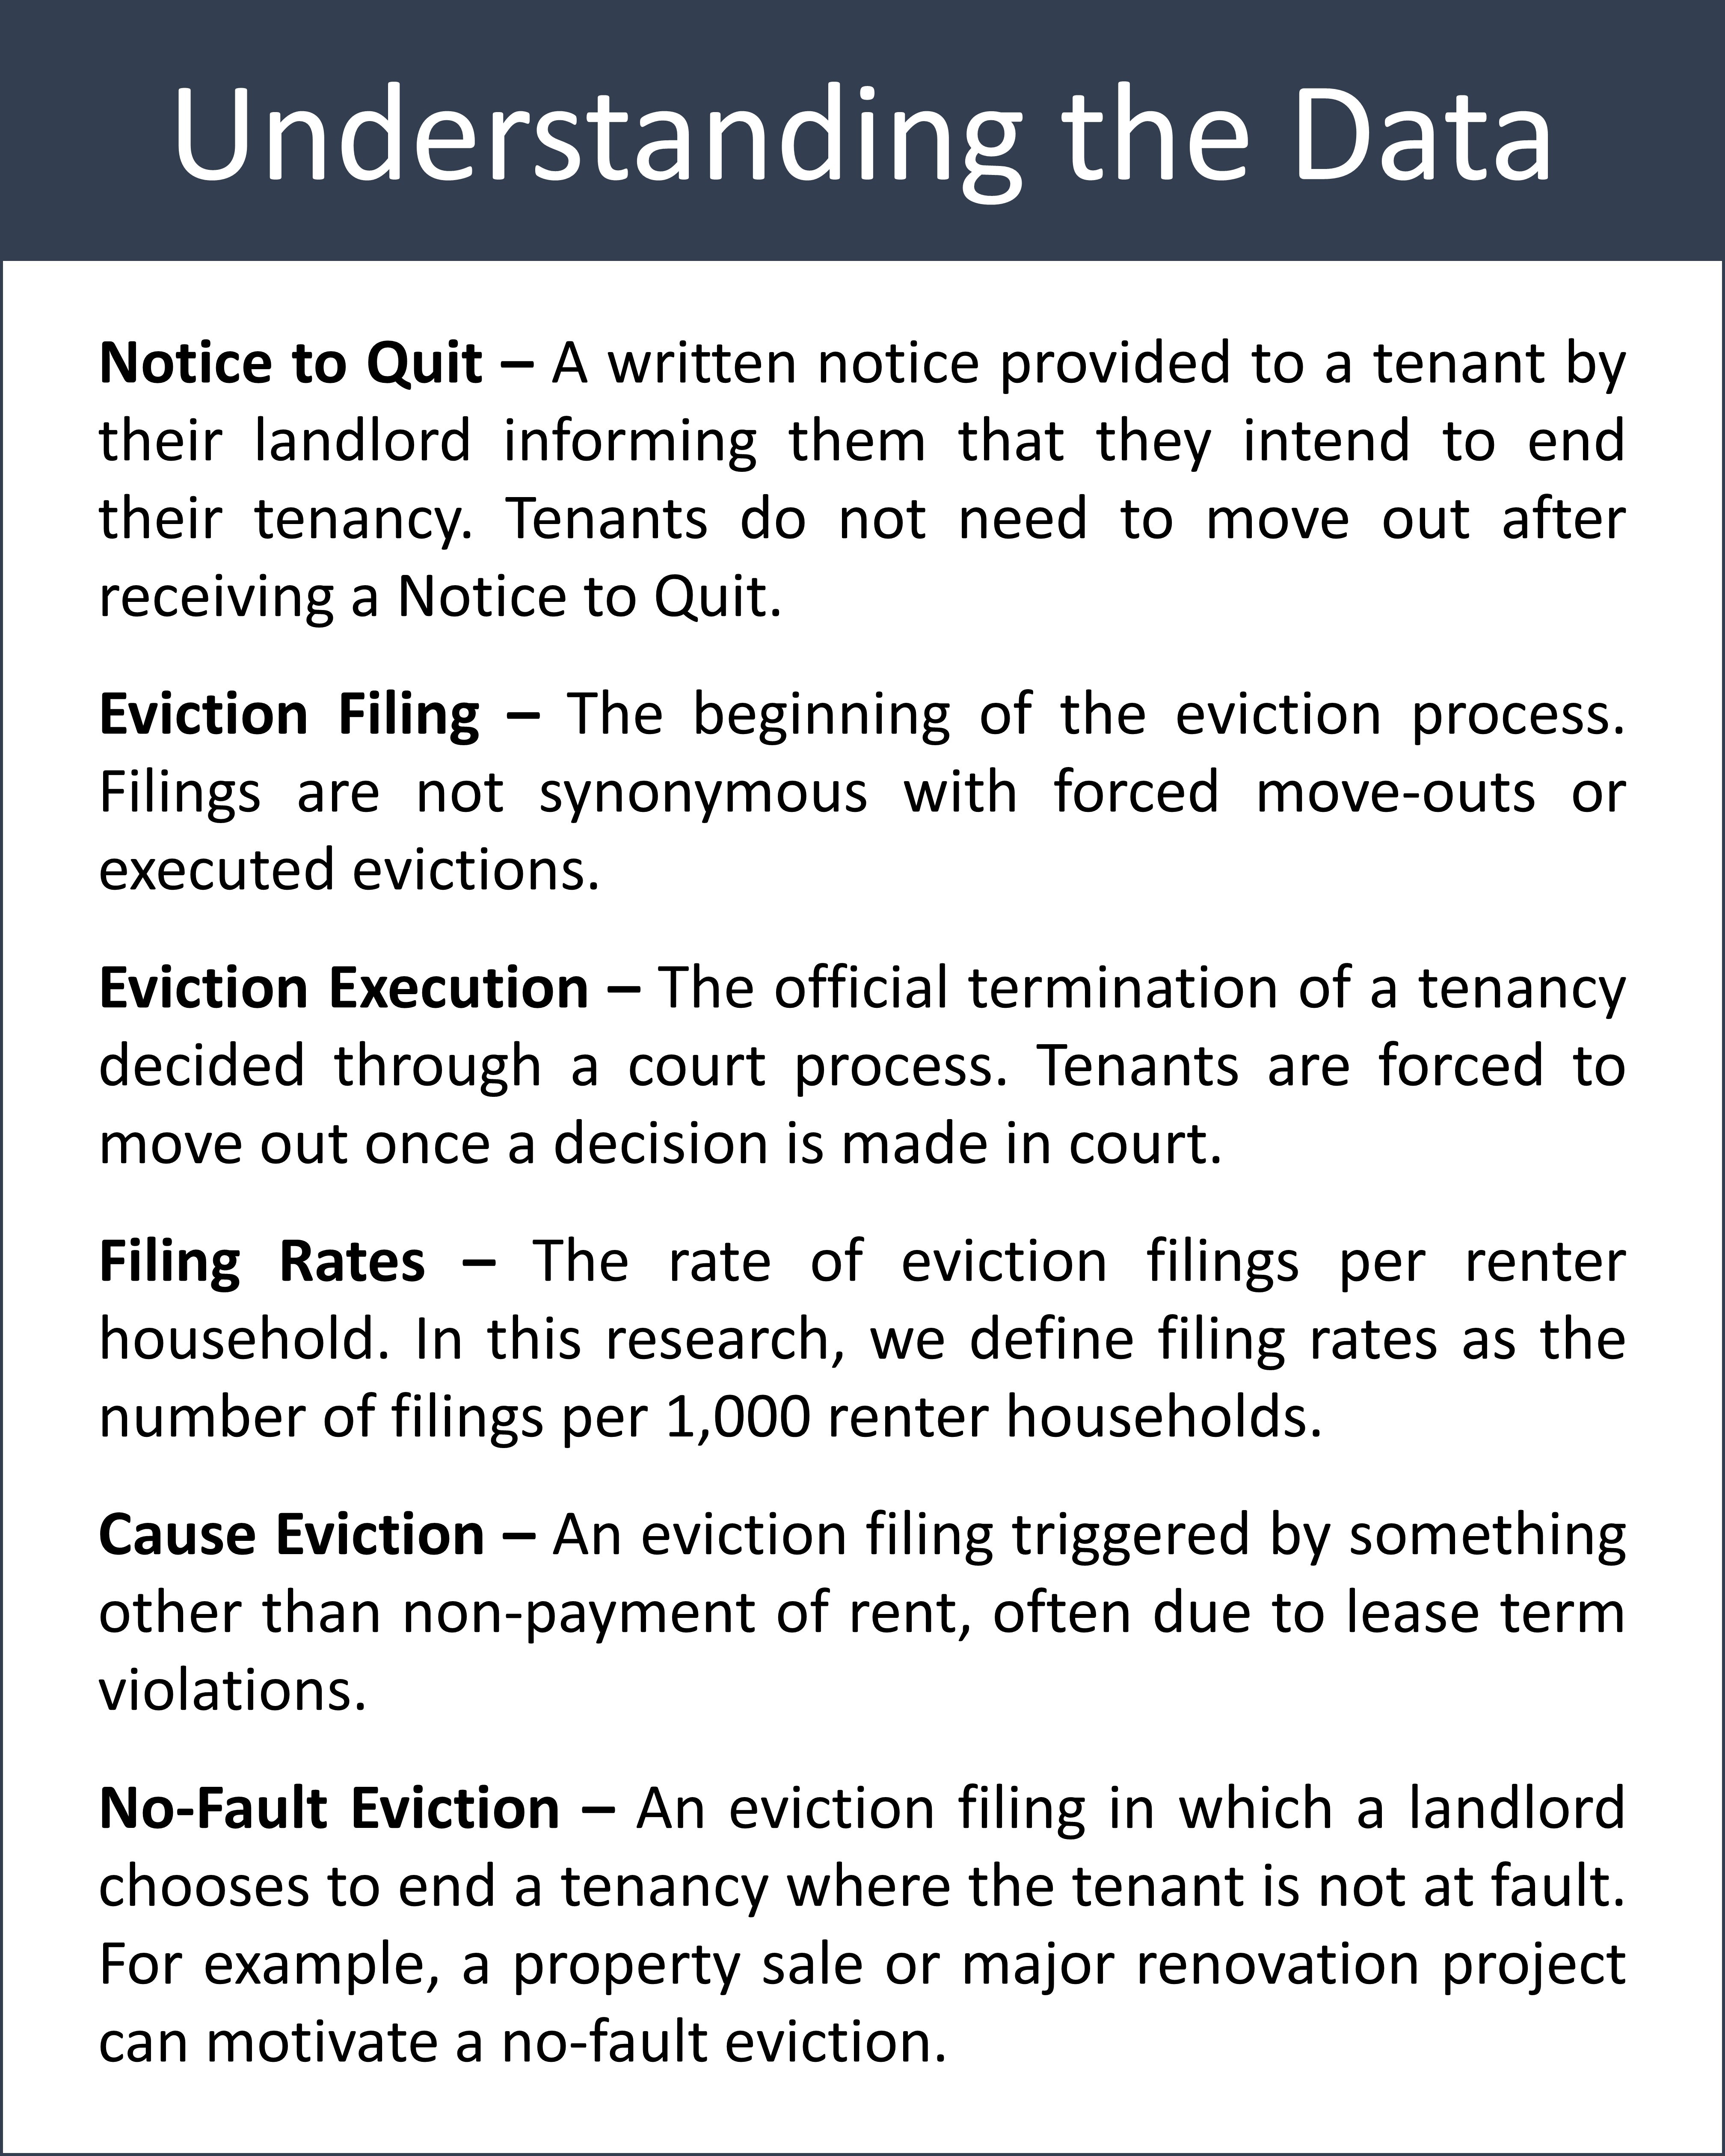
Not all eviction filings are the same. Landlords can initiate an eviction for a variety of reasons, including nonpayment of rent, lease term violations, or for reasons that have nothing to do with their tenants. Evictions due to a lease term violation other than nonpayment of rent are referred to as “cause” evictions. For instance, a tenant allowing someone not named on the lease to live in their unit, smoking inside a property, or causing regular disturbances to neighbors may be reasons for a landlord to initiate a cause eviction. Conversely, “no-fault” evictions are filings that occur when a landlord decides they no longer want to rent to a tenant. Common reasons for no-fault evictions include starting a major renovation project of the property or having a family member take over the unit. Nonpayment is the most common reason landlords initiate an eviction and normally accounts for roughly three quarters of all eviction filings. Cause and no-fault eviction filings together make up roughly one quarter of filings, with cause evictions being slightly more common. Evictions initiated due to a foreclosure are rare but still occur each month.
The bar chart below includes interactive elements; to explore the data further, hover over any bar to see the number of evictions filed each month for the associated initiating action.
- An estimated 19,419 evictions were filed in Massachusetts between July 2025 and December 2025, roughly 3,237 filings per month. This level is well above the pre-pandemic average of 2,600 monthly filings, but consistent with filing levels since late 2022.
- Nonpayment eviction filings accounted for 73.8 percent of all filings within this six-month period.
- No-fault eviction filings made up 10.6% of all filings while cause evictions made up 14.9%. These numbers are consistent with previous trends.
- The beginning of the period of heightened evictions coincides with the August 2022 decision to reinstate the “Notice to Quit” requirement for RAFT applications. The absence of the Emergency Rental Assistance Program (ERAP), which ended several months prior in April 2022, may have also contributed to increased filings.
Regional Trends
Eviction filing rates can differ widely from town to town and lead to disparate housing outcomes across Massachusetts. Identifying regions with high rates of housing instability is key for activating a major tool for advocates and policymakers that can help tailor localized programs to keep Massachusetts residents housed. As housing costs continue to rise across the state, and with the Boston Metro Area still ranking among the most expensive in the nation, renters are competing for an insufficient volume of affordable options.
Previous editions of the Housing Stability Monitor have highlighted Randolph, which has the highest eviction filing rate (45.7 filings per 1,000 renter households) among all Massachusetts cities with more than 2,500 renter households. In September 2025, the Boston Globe published a story exploring the abnormally high rates of eviction filings in Randolph. The report suggested that elevated filing rates were a result of growing rents attributable to the prevalence of large—often out-of-state—corporate landlords, lack of meaningful municipal enforcement of housing code violations, and lack of supportive funds.
Our previous research has also paid particular attention to Hampden County, which currently has the highest rate of eviction filings among all Massachusetts counties by a sizable margin. Hampden County previously experienced much lower rates of filings in 2020 and 2021 due to the commendable efforts of local nonprofit and state actors that disbursed rental assistance funding to households in need at some of the highest rates in the state. As eviction diversion resources made available early in the pandemic have been discontinued, these supportive organizations no longer have the same capacity to stave off eviction pressures.
The interactive maps and charts below allow you to explore eviction filing rates at the municipal and county levels. Hover over any region for additional information.
- The statewide rate of eviction filings was roughly 17.8 filings per 1,000 renter households between July 2025 and December 2025.
- Among all cities with more than 2,500 renter households, Randolph continues to have the highest eviction filing rate in the state with 45.7 eviction filings per 1,000 renter households across the latest six-month period; this rate is more than double the statewide average.
- Other cities with notably high filing rates include Holyoke (43.2), Springfield (39.9), Stoughton (40.1), Braintree (35.1), and Framingham (33.1).
- Among counties, Hampden County leads the state in filing rates, with roughly 31 filings per 1,000 renter households countywide. This rate is significantly higher than all other counties in the state.
Filings and Executions
While some eviction filings are dismissed or reconciled, others lead to an eviction execution, a court order requiring a tenant to move out of the home. Simply put, eviction executions are the least favorable outcomes in the eviction process for tenants. Even if the filing does not result in a court order for the tenant to vacate their home, simply having an eviction filed against them can lead to difficulties down the line when applying for a new unit. The data suggest that roughly one in three nonpayment eviction filings result in an execution. These trends help us understand how many people are facing a loss of tenancy and may be at a heightened risk of homelessness.
The interactive chart below allows you to compare monthly eviction filings for nonpayment of rent with nonpayment related eviction executions. The number of eviction executions lags filings since evictions move through the courts, a process that can take several months after the initial filing. Hover over each month to explore the data in greater detail.
- Between July and December 2025, Massachusetts courts issued roughly 4,824 eviction executions, or 804 eviction executions monthly.
- Approximately 14,323 nonpayment eviction cases have been filed over the study period–roughly 2,387 nonpayment filings per month. This level is consistent with previously observed trends.
- The data suggest roughly one out of three eviction cases result in an execution.
- The persistently elevated levels of executions are concerning given the limited availability of shelter placements for families experiencing homelessness (see following section).
HOMELESSNESS
Growing rates of homelessness have been a major topic of discussion both in Massachusetts and nationwide yet collecting data on populations experiencing homelessness remains notoriously difficult. The data featured below comes from the federal Department of Housing and Urban Development’s (HUD) Point-in-Time (PIT) survey conducted each year on a single night in January and administered within Continuums of Care (CoCs)—local or regional planning bodies that coordinate housing services and funding for individuals and families experiencing homelessness. One of the reasons the PIT survey is conducted in January is because it is more likely that people experiencing homelessness will elect to stay at individual or family shelters, rather than outside or in other places not suitable for habitation. This helps surveyors collect a more accurate count of the homeless population but also makes estimating the true proportion and magnitude of people experiencing unsheltered versus sheltered homelessness difficult. It is important to note that HUD has not released the official 2025 Point-in-Time count as of the date of this brief; the Massachusetts Executive Office of Housing and Livable Communities (EOHLC) has compiled the internal Point-in-Time counts administered by local Continuums of Care and shared this data with our research team.
Interpreting homelessness in combination with evictions and foreclosures helps us understand the magnitude of housing instability in Massachusetts, particularly the proportion of the population in crisis. The interactive chart below allows you to explore homelessness at the regional level and compare unsheltered and sheltered homelessness year over year.
- Homelessness remains at the highest levels on record since 2007 with few signs of improvement since 2024, as over 28,000 adults and children surveyed were experiencing homelessness in January of 2025.
- The total surveyed population experiencing homelessness increased by over 10,000 between January 2023 and January 2024 and nearly doubled since 2022. While the increase in homelessness from 2023 to 2024 can be partially attributed to the arrival of migrant families in Massachusetts and other parts of the country, 2025 shows a minor decline to still unprecedented levels of housing insecurity in our state.
- Unsheltered homelessness is the highest it’s been in nearly two decades, with 1,748 individuals experiencing homelessness in January 2025.
- Lynn CoC, Worcester City & County CoC, Berkshire, Franklin, & Hampshire County CoC, Fall River CoC, and Springfield & Hampden County CoC all saw increases in unsheltered homelessness from 2024 to 2025. All other CoCs saw a decrease in total homelessness over this time.
- Between 2024 and 2025, the number of individuals experiencing homelessness in Worcester and the surrounding county increased from 1,927 to 2,864, a 48.6 percent increase. It is unclear what is driving this increase.
Family Shelter System Trends
Massachusetts remains the only state in the nation that legally protects a right to shelter for families experiencing homelessness. For decades, our family shelter system has been a crucial safety net, providing emergency housing for families with children across the state. In large part due to the Emergency Assistance (EA) system reaching its original 7,500-household maximum capacity in November 2023 for the first time since the inception of the right-to-shelter law, the state has been implementing policies aimed at transitioning families out of shelter more rapidly, while simultaneously reducing shelter capacity due to budgetary concerns. As of 2026, the EA shelter cap has been reduced to 4,000 families. Examining data on emergency shelter utilization has become increasingly crucial in light of these reductions in support.
Solving the present-day housing crisis requires improving housing outcomes for everyone living in Massachusetts through a focus on upstream support. While reactive, downstream programs such as the EA shelter program need greater capacity to address acute needs, a longer-term strategy to remove structural barriers will reduce hardships and alleviate demand pressure on emergency systems over time. These barriers include the constrained supply of new affordable housing, low production inhibited by restrictive zoning and exorbitant development costs, the absence of upstream (pre-Notice to Quit) rent relief funding and legal measures encouraging landlords to engage in alternative systems rather than pursuing eviction, and the scarcity of affordable units in subsidized and public housing. Focusing our efforts on these issues would reduce the strain on our EA system, which would allow us to provide better services to all families experiencing homelessness in Massachusetts and prevent more families from entering the system in the first place.
The chart below features data collected from the Executive Office of Housing and Livable Communities’ biweekly reporting on the Emergency Housing Assistance Program (EHAP). Hover over the chart to view the data in more detail.
- The total number of families receiving EA is at the lowest level it’s been in years, with an estimated 1,551 families accessing EA shelter in December 2025 – well below the 4,000-person shelter cap instituted at the start of 2026.
- Shelter utilization dropped from July 2025 to December 2025, consistent with trends over the preceding several months, as shelter numbers decrease month after month following the reduction in shelter system capacity.
- Between November 2023 and November 2024, the EA shelter system was at, or slightly below, capacity for one full year.
- Eviction and foreclosure trends have remained relatively consistent over this entire period, so the rapid drop in the number of families accessing shelter raises concerns about where people experiencing severe housing instability are ending up.
FORECLOSURES
Foreclosure trends provide an important analogue to evictions and help us understand how homeowners in Massachusetts are managing the cost of housing. Owner-occupied households make up roughly 62.5 percent of all households in Massachusetts and outnumber renters by nearly 700,000 households, according to 2024 data from the American Community Survey. However, on average, owner households have substantially higher incomes compared to renters ($135,402 median income for owners compared to $60,987 for renters) and significantly lower rates of cost burden—defined as spending less than 30 percent of their income on housing costs. Despite high monthly costs for owners and renters alike, homeowners tend to have more stable and consistent mortgage payments, and fare better than renters contending with an ultra-competitive housing market and ever-growing rents.
Still, hundreds of foreclosure petitions are issued each month, with a portion resulting in households losing their homes. Of course, foreclosure petitions on their own constitute a distressing event for homeowners and may contribute to major life changes, including a preemptive sale of a property even when they do not result in a foreclosure. While the last several years of foreclosure data post-COVID suggest Massachusetts homeowners have relatively low levels of distress, examining foreclosures remains an essential undertaking for researchers and advocates, particularly if these trends take a turn for the worse.
The chart below displays monthly data on foreclosure petitions and foreclosure deeds across the entire state. Hover over each month of data to view detailed information on foreclosures over the full range of dates.
- Between July 2025 and December 2025, an estimated 1,960 households have been issued foreclosure petitions. Monthly, this averages out to roughly 327 foreclosure petitions.
- The data suggest that roughly 1 in 5 foreclosure petitions resulted in a foreclosure deed. Over the study period, there were a total of 433 foreclosure deeds compared to 1,960 foreclosure petitions.
- Between 2024 and 2025, annual foreclosure petition levels dropped by an estimated 13.9 percent. Monthly foreclosure petition rates dropped from 373 per month in 2024 to 321 per month in 2025.
- Statewide foreclosure petition and foreclosure deed rates have remained stable since the end of the pandemic-era foreclosure moratorium, as data continues to suggest that a minority of homeowners are cost burdened, especially when compared to renter households.
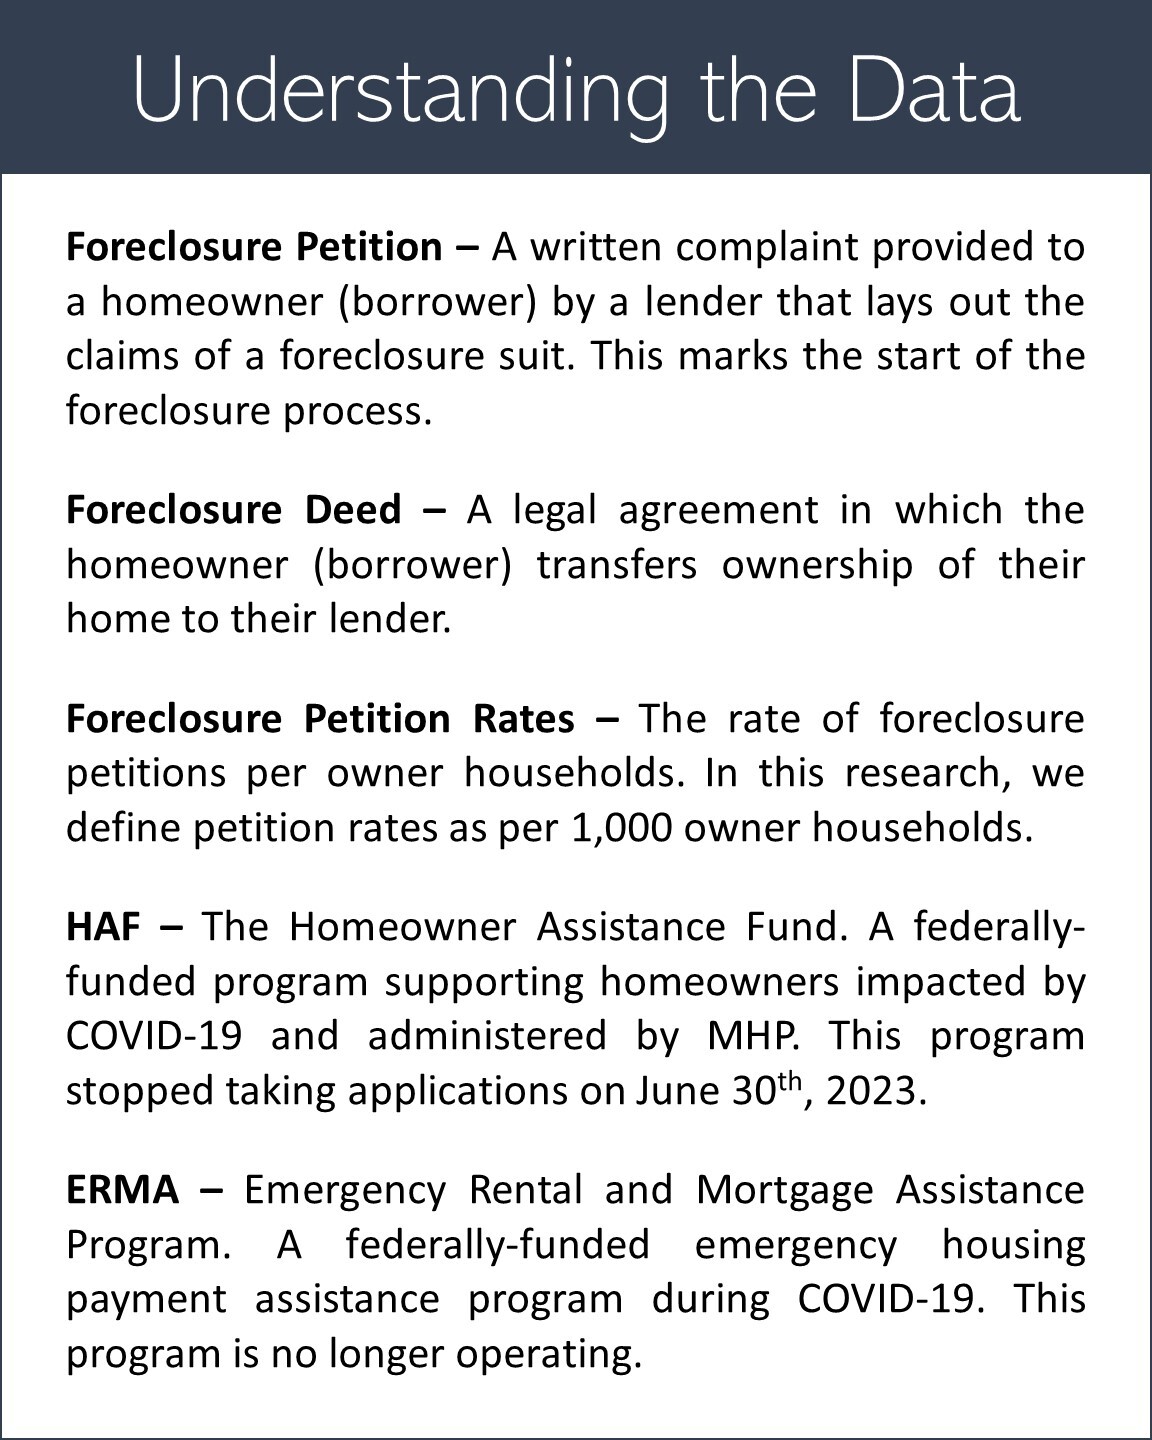
- In previous analyses, we observed a slight uptick in petitions since July 2023 following the Homeownership Assistance Fund (HAF) program’s closing; however, these numbers are still below pre-pandemic rates.
Regional Trends
While statewide data suggest that Massachusetts homeowners are relatively stable, foreclosure trends at the municipal level can give us insight into how these trends vary from region to region. Previous analyses have found higher rates of foreclosure petitions in Western Massachusetts, particularly in Hampden County, as well as in Dukes County (Martha’s Vineyard), and lower rates of petitions in the inner ring suburbs.
While foreclosure petition rates are relatively low across the state, the data show clear regional trends over the six-month study period. We observed relatively low rates of foreclosure petitions in the inner-ring suburbs surrounding Greater Boston, along with low petition rates in the Pioneer Valley suburbs outside Hampden County. Individual communities continue to stand out—particularly Springfield and Brockton—which have both elevated rates of foreclosure petitions and eviction filings.
The abundance of supportive funding during the pandemic through RAFT and HAF was instrumental in keeping foreclosure rates at stable levels. Currently, homeowners in need of assistance can still apply for funding through the Massachusetts’ Residential Assistance for Families in Transition (RAFT) program, though these requests are limited to $7,000 annually.
The interactive map and table below allow you to explore foreclosure petition rates at the municipal level. Hover over any community for detailed breakdowns.
- As noted previously, foreclosure rates have remained stable relative to pre-pandemic trends. At the regional level, foreclosure petition rates show some variability among municipalities and across county lines.
- Among larger municipalities with more than 2,500 owner households, Springfield has the highest rate of foreclosure petitions between July 2025 and December 2025 with an estimated 3.79 petitions per 1,000 owner households.
- Other communities with notably higher rates include Gardner (3.36), Brockton (3.35), Fitchburg (2.73), Norton (2.35), and Holyoke (2.33).
- Dukes County leads all counties in Massachusetts in foreclosure petition rates, with 3.46 petitions per 1,000 owner households. Hampden County has the second highest rate, with 1.99 petitions per 1,000 owner households.
For questions related to eviction and foreclosure data in your community, or additional information about this research, please contact Matija Jankovic.
For more information contact MHP Communication Manager Lisa Braxton, (857) 301-1526.
Eviction filing data is provided by MassLandlords Inc.
Author's Note on Eviction Data: Statewide eviction data is particularly difficult to access through the Massachusetts Trial Court database, which creates unnecessary roadblocks to conducting research, such as this piece, to inform policy and provide a public benefit. This analysis is made possible thanks to the MassLandlords team’s diligent efforts in compiling community-level eviction filing data. However, we believe that efforts need to be made by state agencies and policymakers to ensure public access to housing stability data. The Center for Housing Data will continue to support these efforts in the coming year.
Foreclosure data is provided by The Warren Group.
PREVIOUS HOUSING STABILITY MONITOR RELEASES
FIRST EDITION – September 2023 (PDF)
SECOND EDITION – January 2024 (PDF)
THIRD EDITION – April 2024 (PDF)